
I am a ‘bottom–line’ type of guy. I remember several years ago, my daughter came home one evening and began to tell me a story about a very dark road, a street lamp that wasn’t working, and how all the cars were cramped into a small space. She was excited and I was confused. I stopped her abruptly, waving my hands back and forth as if I were trying to stop a car. I yelled, “Give me the bottom line!”
She said, “Dad, your son backed into another car this evening.” Yes, that was the bottom line and needless to say, I was not happy. I then worked my way through the story backwards, getting the details I needed because I knew I had to call the insurance company.
I find IT managers and non-IT managers often experience similar communication challenges, especially when it comes to reports. If an IT manager communicates down–time statistics for a router with a non-IT business manager, the non-IT business manager is going to ask, “How does that affect me?”
IT asset management reports and dashboards need to show the ‘bottom line’ to the different non-IT business managers. Remember, the ‘bottom line’ is going to be different for each department. What is important to them is determined by their objectives, and each department will have different objectives.
In part 1 of this blog, I introduced four ingredients to build a meaningful ITAM dashboard.
- Build dashboards integrated with ITSM data
- Display trends
- Create queries aligned with each department’s strategy and objectives
- Create business value dashboards (BVDs)
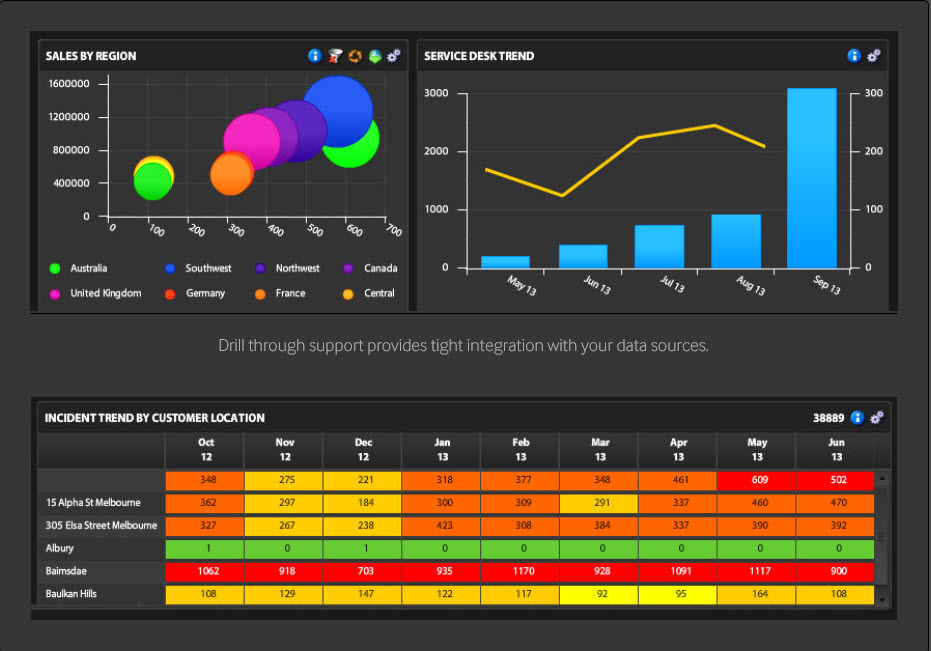
If you build dashboards that include information from your ITSM solution, you will be able to provide additional information about IT assets including the cost to support those assets.
Display trends
Trending information should include how often help is required from end-users while using software tools to meet their objectives. By integrating ITSM data, you will have a wealth of information available to build trending dashboards for your assets. For example, trends can show if training is adequate based on how often help requests are made to the ITSM knowledge base.
Trends can tell you if your software solutions meet performance requirements and whether or not any issues are related to the software or to training. For example, an application that updates a database might slow down during certain times of the day, resulting in increased support incidents and decreased output.
Build hardware trends that track vendor and model. The cost of a failed laptop includes loss of productivity and/or loss of data, as well as the time required by IT services to address the problem. Trending reports can identify specific models that tend to have a higher fail rate over other models.
Trending reports provide IT asset managers with valuable information; however, the challenge will be how the dashboard adds value to non-IT business managers of the organization.
Create queries aligned with each department’s strategy and objectives
IT department managers need to have a good understanding about what information is relevant to each non-IT business manager. Remember, each business manager will differ in what is important to them, so work with business managers to understand what type of data would help them with their objectives, then build dashboards that are relevant to each business manager.
For example, imagine a company website that generates revenue. The sales organization might be concerned about the performance of the website used to sell a product so may utilize website monitoring systems. Queries that display performance metrics, support incidents, change requests, or down-time related to the website might be relevant for the business manager and not the sales department. However, the accounting department business manager might be interested in queries that find warranty, contract, and maintenance renewals schedules so that he/she can properly forecast operational expenses, this might be more suited to the likes of product analysis software to analyze the aforementioned metrics that can be developed by the likes of Heap Analytics and similar companies.
Create business value dashboards (BVDs)
After you have aligned IT asset data queries to the objectives of the organization, and the departments within the organization, I suggest you translate the results into business value dashboards (BVDs). BVDs are aligned to the organization’s business objectives verses the IT department’s objectives.
The primary audience for BVDs are business managers and executives of the organization. These dashboards will show the value of IT asset management and the role IT plays in meeting the organization’s objectives.
In a gated report titled Market Guide for I&O Business Value Dashboards, Gartner states “the I&O organization is accustomed to dealing with metrics such as network availability, application uptime, response time and mean time to repair, whereas the business ultimately cares how those things translate into revenue, cost, risk or some other business value metric.”
Gartner also predicted “by 2020, more than 50% of infrastructure and operations (I&O) organizations will adopt business value dashboards (BVDs), which will be a significant increase from today’s level of less than 10%.”
Colin Fletcher, Research Director, IT Operations Management for Gartner, talks about the emergence of the business value dashboard (BVD).
A single ITAM query can produce information that is relevant to multiple business managers throughout your organization however, the way the information is presented through a dashboard may differ according to what is relevant to each manager.
Business Value Dashboard Scenario for ITAM
Let’s take a look at software license vs. software installation data as an example for creating an ITAM BVD.
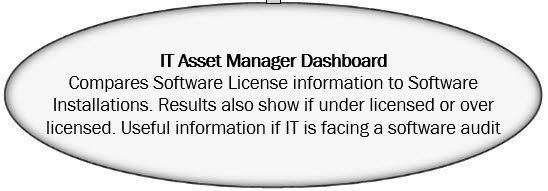
An IT Asset Manager can look at a dashboard that shows how many installations the organization has installed and then compare the information to the license agreement. This information is valuable to the IT Asset Manager if the organization is audited.
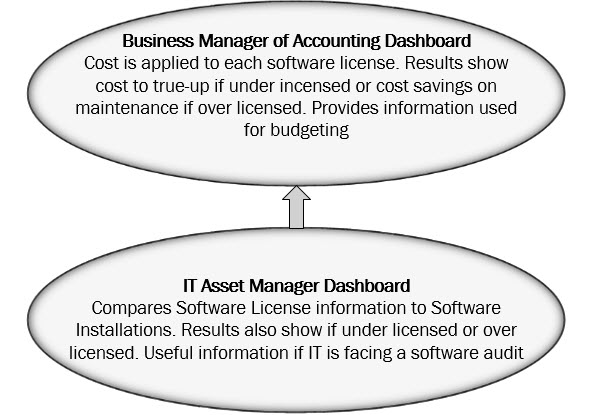
Imagine if the organization needed to purchase 100 additional licenses. By applying cost to the dashboard, you could show that it would cost $10 per license to comply with the license agreement. This additional $1,000 would be important information for the accounting business manager to have on a dashboard. This information could be used for budgeting purposes which is the accounting department’s objective.

Now imagine if you could take the software usage information over the past six months. Then create a dashboard that shows 500 software installations were not utilized during that period, therefore, if the organization removes those installations, it would reduce the upcoming renewal fee at $20 per license totaling $10,000.
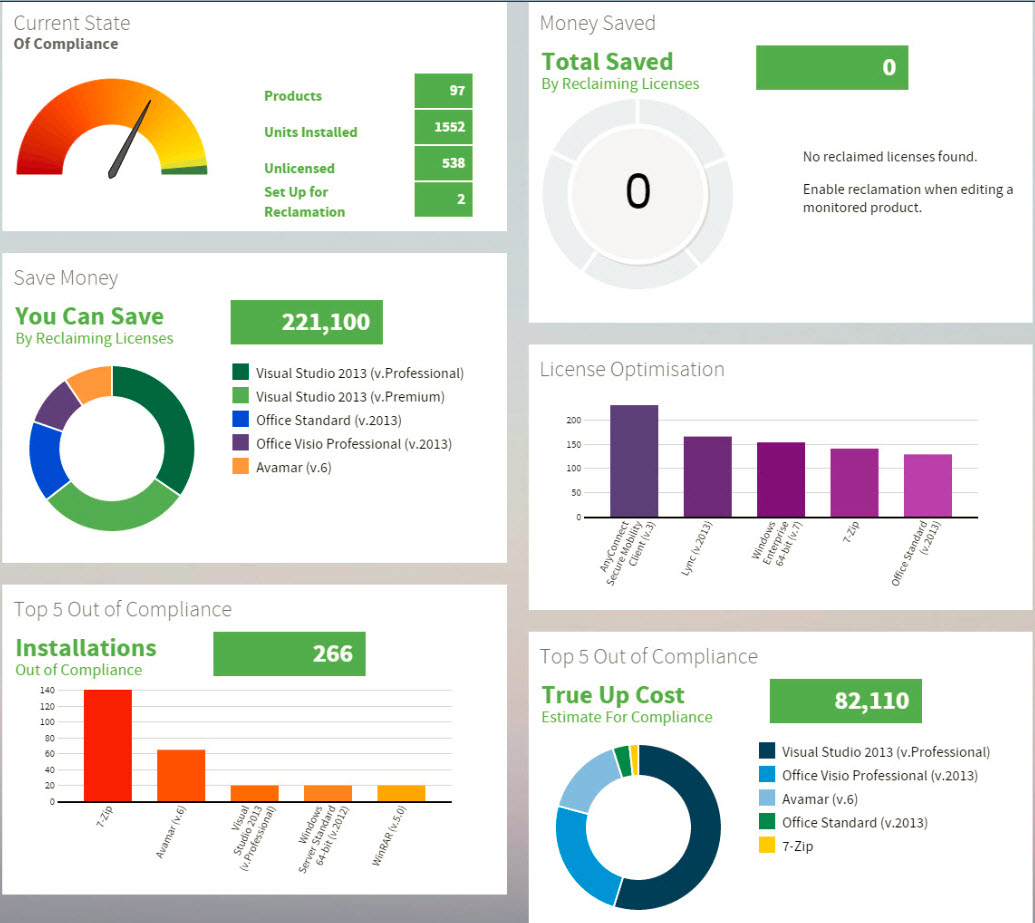
Dashboards that can show a cost savings scenario would be of value to executives and decision-makers.
Summary
ITAM dashboards can provide complete visibility into every system within an organization. The knowledge that is provided can be used to make informed decisions about IT strategy and IT asset acquisitions. IT Asset Managers can add value to an organization by learning how each business within the organization operates, thus assisting them by displaying relevant information using dashboards.
I believe the value of IT asset data is only as good as what can be clearly and accurately reported through dashboards. Organizations should explore reporting tools that can provide data from multiple data sources, tools that are easy to use, and tools that can display dashboards which are easy to understand.
-follow me on Twitter @marcelshaw
1 thought on “Four Ingredients to Build Meaningful ITAM Dashboards (Part 2 of 2): Add Value”
Comments are closed.